Financial analysis
Financial analysis can seem intimidating, like a secret language spoken only by accountants and Wall Street wizards. But fear not, fellow human! This guide will break down the essentials in plain English, making those pesky numbers a little less scary.
What is Financial Analysis, Anyway?
Simply put, financial analysis is the process of examining a company’s financial statements to understand its performance and make informed decisions. Think of it as a financial checkup – we’re looking under the hood to see if the engine is running smoothly, if there are any leaks, and if the car is ready for a long road trip.

Why Bother with Financial Analysis?
Determine a company’s profitability
Assess its financial health and stability

Identify potential risks and opportunities
Make informed investment decisions
Tracking your company’s progress
Identifying areas for improvement
Making strategic business decisions
Securing funding from investors or lenders
Key Financial Statements: The Holy Trinity
Three main financial statements form the bedrock of financial analysis:
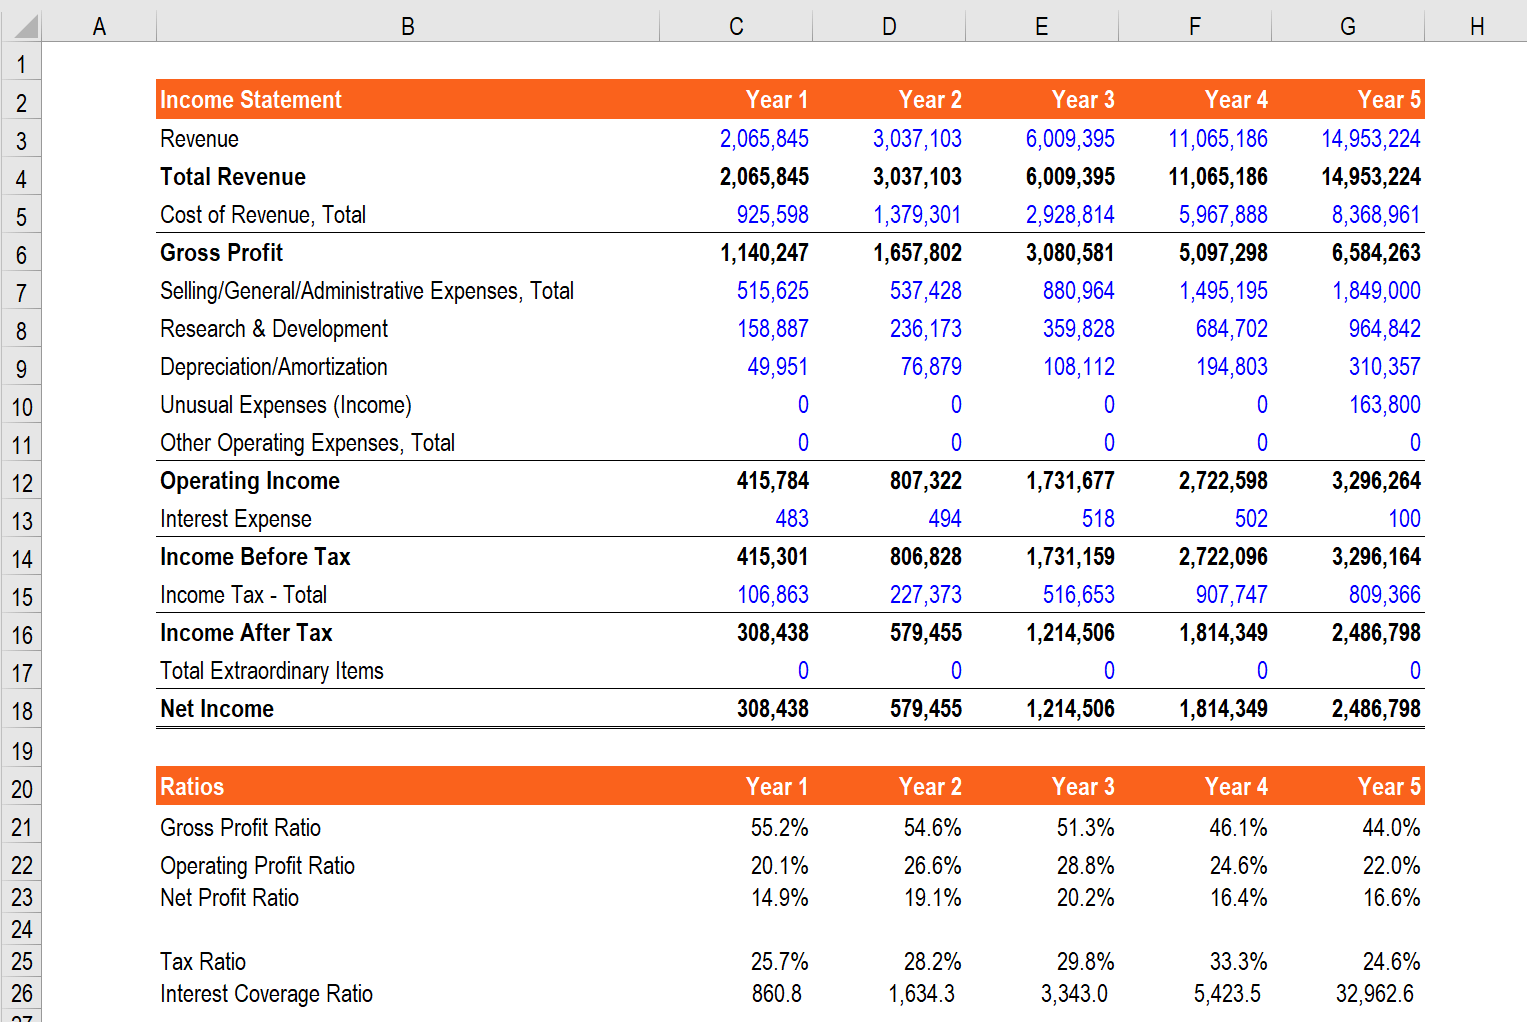
Key metrics include:
Revenue
Cost of Goods Sold (COGS)
Gross Profit
Operating Expenses
Net Income
Assets: What a company owns (cash, property, equipment)
Liabilities: What a company owes (debt, accounts payable)
Equity: The owner’s stake in the company
How a company generates cash
How cash is used
The company’s liquidity (ability to meet short-term obligations)
Financial Ratios: Telling the Story
Financial ratios are like the detectives of the financial world. They help us uncover hidden patterns and relationships within a company’s numbers. Here are a few key ratios:
Gross Profit Margin:
Measures how much profit a company makes on each dollar of sales after accounting for the cost of goods sold.
Net Profit Margin:
Shows the overall profitability of a company after all expenses are deducted.
Return on Equity (ROE):
Measures how effectively a company uses shareholder’s equity to generate profits.
Current Ratio:
Assesses a company’s ability to meet its short-term obligations (bills) with its current assets.
Quick Ratio (Acid Test):
A more stringent test of liquidity, excluding inventory from current assets.
Debt-to-Equity Ratio:
Indicates the proportion of debt financing relative to equity financing.
Debt-to-Asset Ratio:
Shows the percentage of a company’s assets financed by debt.
Analyzing Trends: Looking for the Bigger Picture
Don’t just look at a single set of numbers. Analyze financial trends over time.
Are profits increasing or decreasing?
Is the company growing its revenue?
Is debt increasing at an alarming rate?
How does the company compare to its competitors?
Tools of the Trade: Making Analysis Easier
Financial Modeling Software: Programs like Excel or specialized software can automate calculations and generate reports.
The Human Element: Beyond the Numbers
While numbers tell a significant part of the story, financial analysis is not just about crunching data. Consider these factors:
Competitive Landscape: Analyze the industry the company operates in. Is it a growing industry? Who are the major players?
Conclusion
Financial analysis may seem complex, but it’s a valuable skill for anyone interested in business or investing. By understanding key financial statements, ratios, and trends, you can gain valuable insights into a company’s health and make more informed decisions. Remember, financial analysis is an ongoing process. Regularly review and update your analysis to stay informed about a company’s performance.
Disclaimer: This article is for informational purposes only and should not be considered financial advice.
I hope this article has demystified the world of financial analysis. Happy analyzing!